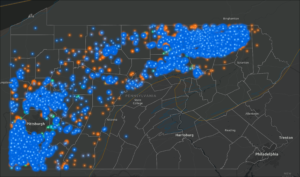
 The latest version of the Carnegie Museum of Natural History Pennsylvania Unconventional Natural Gas Wells data set is now available. The update includes all well records through the September 30, 2019, except for Production and Waste reports which are through August 2019. The data is available at our Download page.
There were no major updates to the PA Unconventional Natural Gas Wells geodatabase. For information about past updates, see the Version Information page.
For more information about the geodatabase, please see the Metadata and User License Agreement. The data can also be viewed without GIS software using our web mapping application.